Optimizing for Growth
Key achievements
1.4 → 4.7
App store rating increase.
14% → 29%
Gaming apps revenue share growth.
30% → 44%
Total apps revenue share increase.
6 → 25
Increase in annual app release cadence.
1 → 4
Brands with dedicated apps.
£6m → £9.5m
Increase in tournaments turnover.
20% → 40%
Doubling the tournaments progression rate.
Context
Our casino apps were a liability disguised as a channel. The main Unibet app had a 1.4 App Store rating, accounted for just 14% of gaming vertical revenue, and we were shipping roughly six updates a year. We had no real native engineering capability, no process for building new apps, and a single native designer working in isolation. Apps sat at 30% of company-wide revenue, third behind desktop and mobile web, which, given where the market was heading, couldn't continue.
At the same time, our tournaments, one of our strongest retention tools, were reaching only 10% of customers, with just 20% of those who opted in actually progressing. For a feature positioned as a key differentiator, that was a significant growth ceiling.
Two different problems, different approaches, but a shared thread: unrealized revenue behind experience and perception barriers that design could directly address.
Leading the rebuild of the apps
When I returned to the casino vertical, the native rebuild had just started. I built the team around it: hiring designers, moving a promising junior from another business unit into my group, and bringing on a content designer as my first content design report.
The content layer across apps needed as much attention as the interface, and having that capability on the team changed how we approached every screen.
I defined the strategy by applying what I'd built for web and mobile web in earlier work.
Iterative, component-driven releases rather than a big-bang rewrite, aligned with the iOS engineering teams we were standing up. My role was guarding quality and driving alignment.
I owned the design backlog, ran crits, coached designers, checked work against Apple's guidelines, and occasionally stepped in for small adjustments when a design needed it. I defined A/B tests and identified which parts of the experience to test first based on where we expected the highest impact.
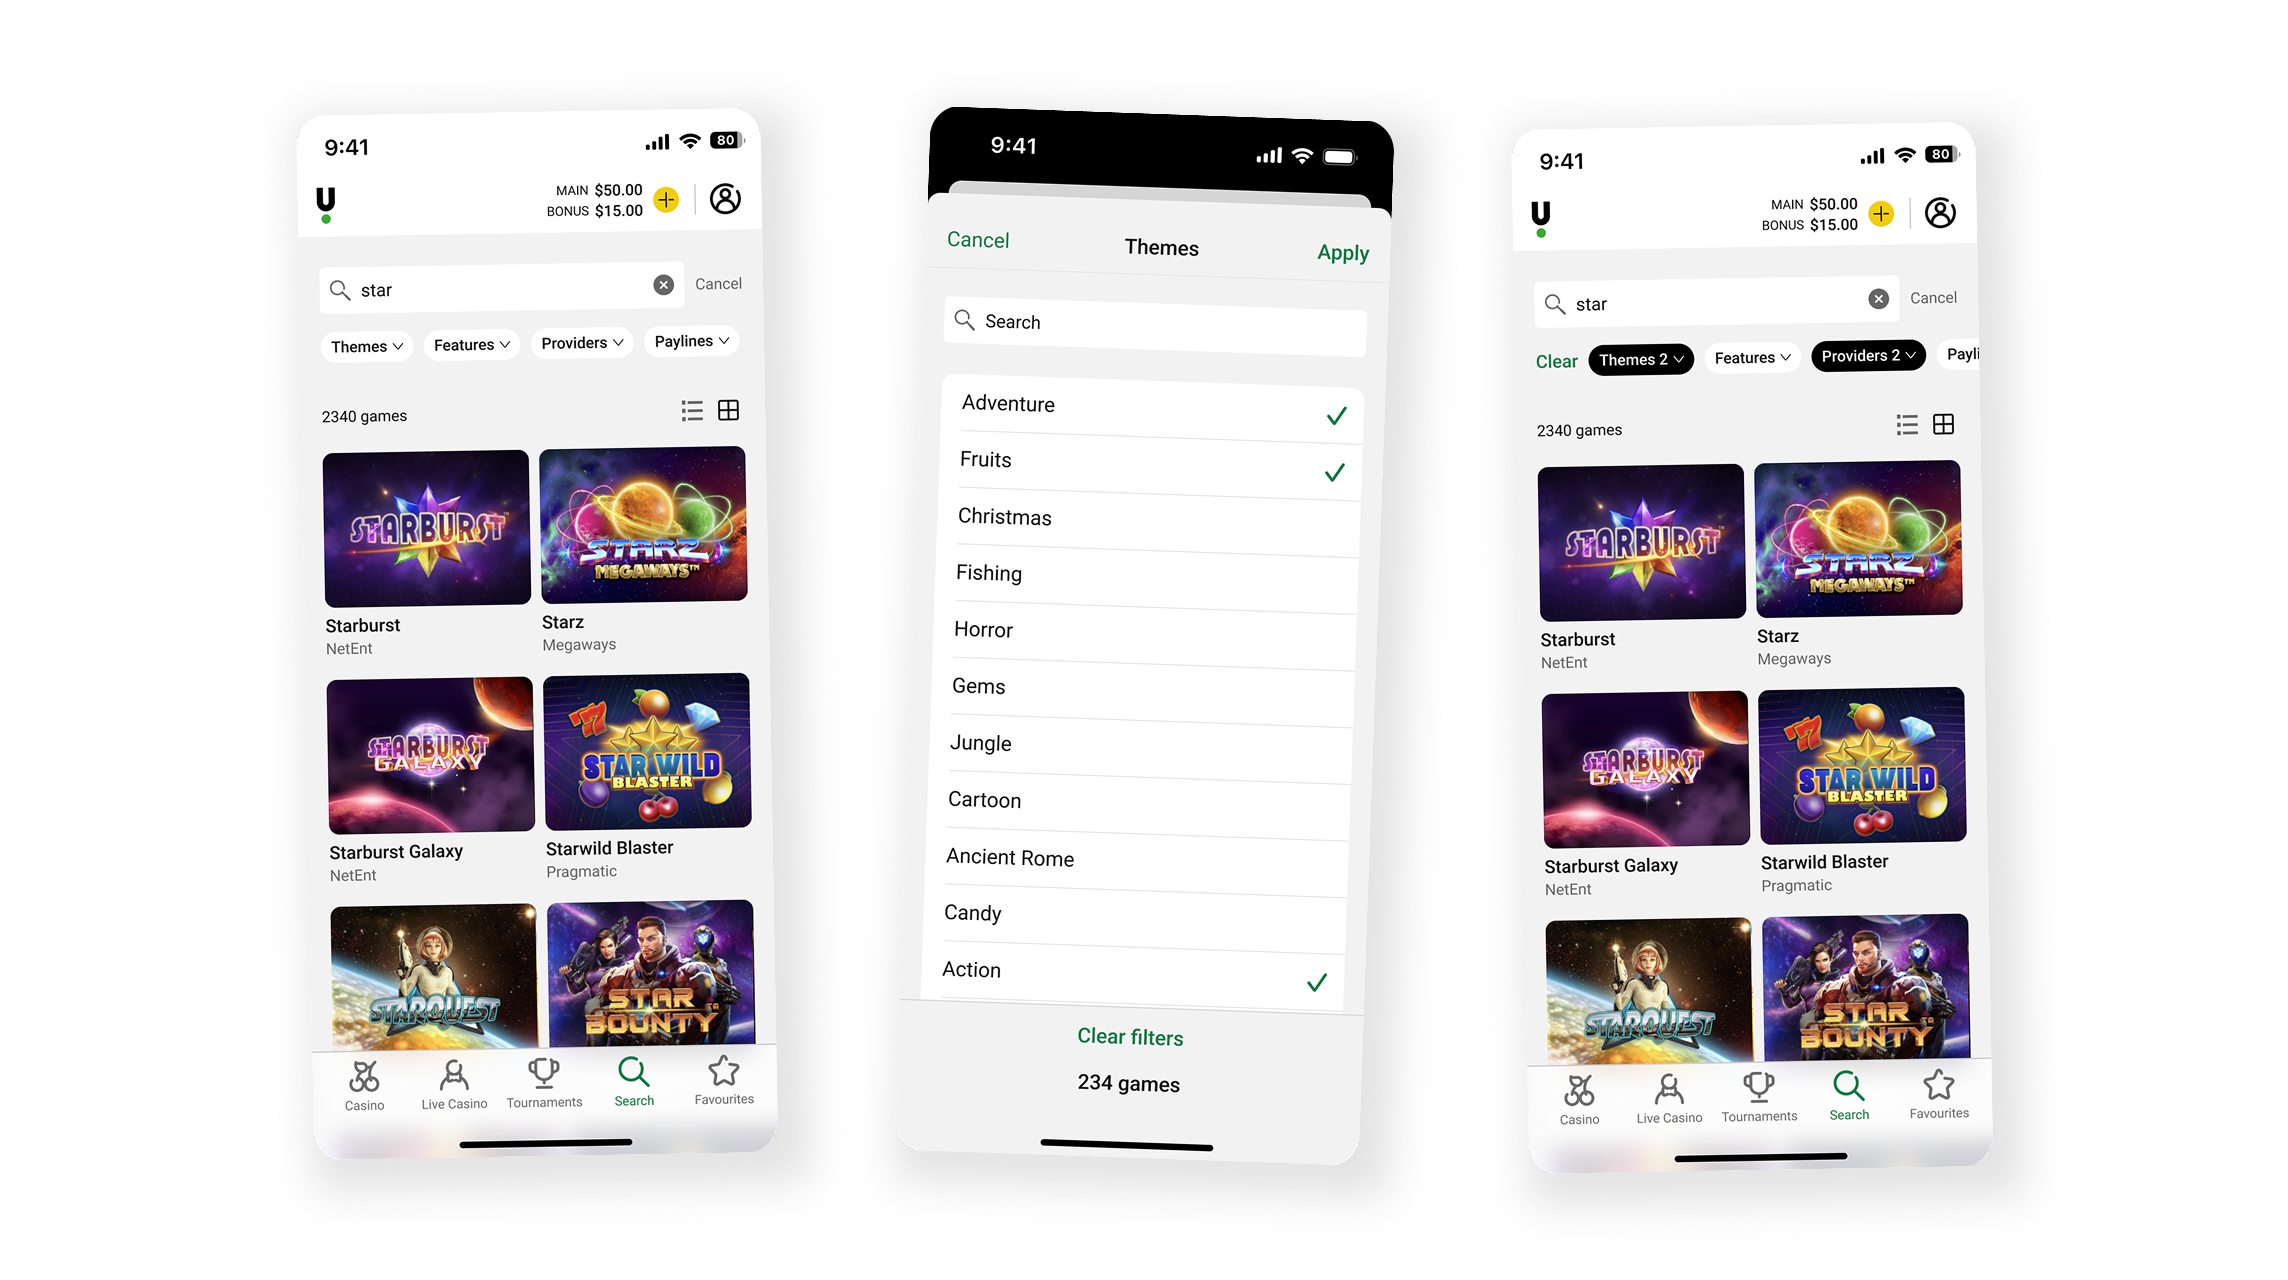
Advanced search started as unique app feature.
Measuring the impact
I pushed back on how success was measured. Product owners at the time were setting weak or absent success metrics, often focused on output rather than outcome. Some weren't setting them at all. I reframed our targets around revenue impact rather than engagement proxies that could be shuffled between touchpoints without actually growing anything.
There was friction between native and web tracks. Stakeholders wanted parity, but the two channels were in fundamentally different places technically and experientially.
I facilitated that gap through workshops, stakeholder interviews, and roadmap alignment, working with the native product owner and channel owner to push a native-first approach. It took some time, but the company formally adopted it as the standard method by 2025.
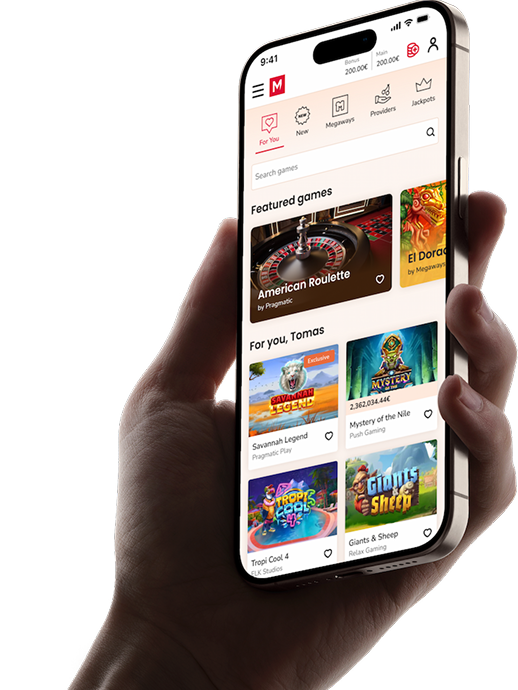
Unibet Casino App.
Maria Casino App.
The result
In Q4 2025 apps became the largest revenue channel for the company. And not only that, also:
- The App Store rating moved from 1.4 to 4.7
- App revenue share within gaming grew from 14% to 29%
- Company-wide, apps grew from 30% to 44% of total revenue
- Release cadence went from 6 to 25 updates a year
- Unlocked dedicated apps for 32Red, Vlad Cazino, and Maria Casino
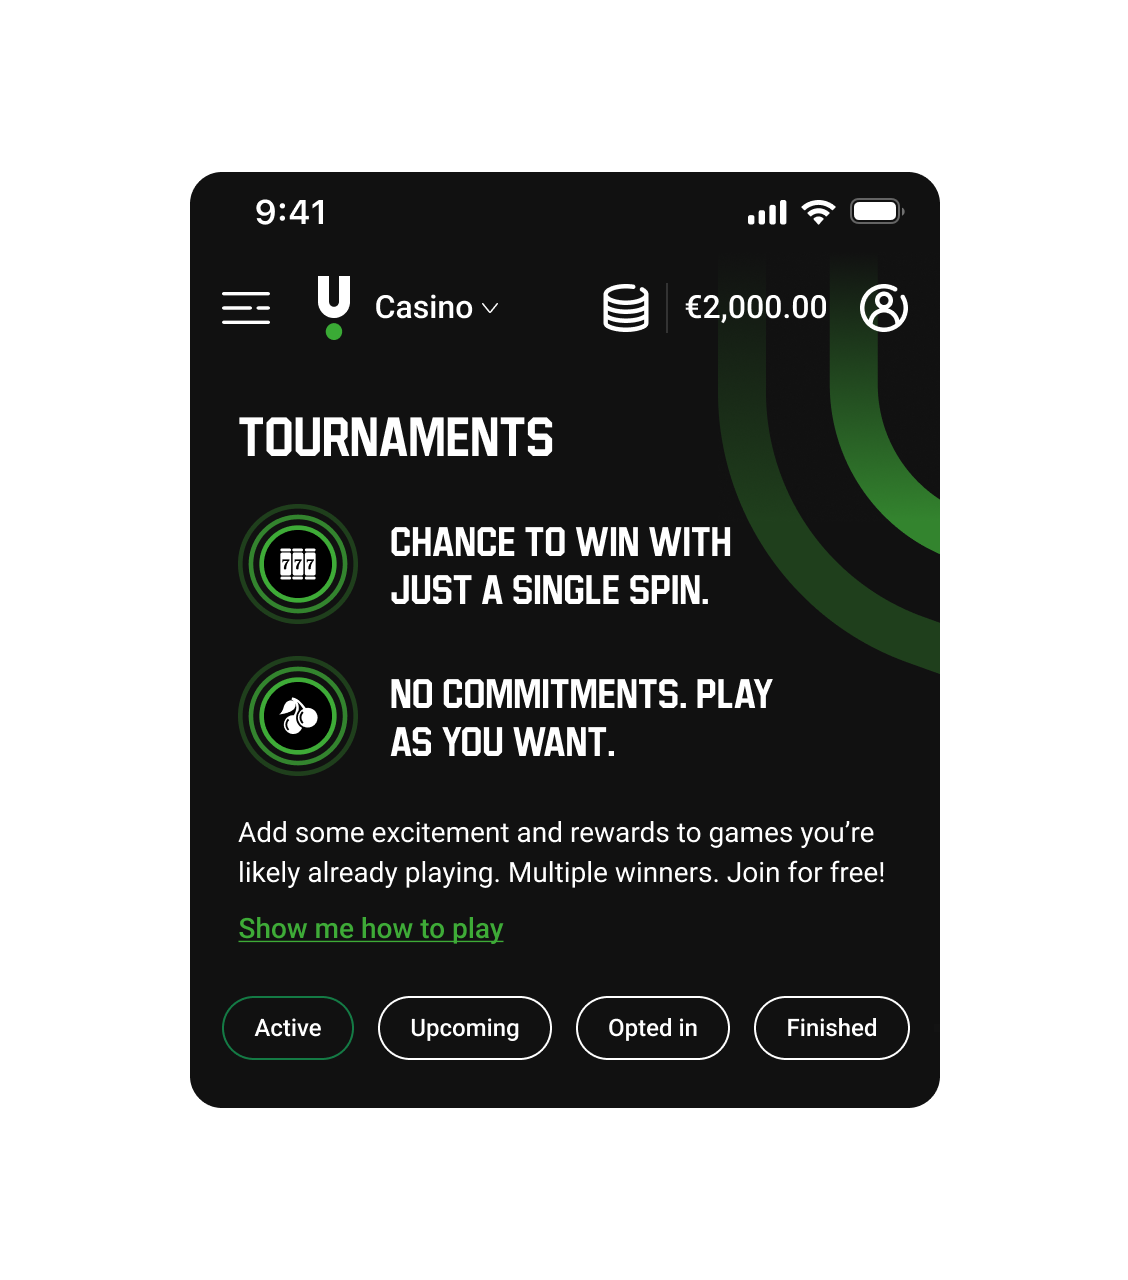
Redesigning Tournaments for Engagement
The director of casino identified tournaments as a growth lever worth investigating. Through continuous discovery, specifically a series of user interviews, we surfaced four perception barriers.
Easy to miss
Because of their time-limited nature.
Hard to win
Even though there we usually 250 winners.
Need of commitment
Not true for 90% of tournaments.
Hard to understand
Most players don't know how they work.
These weren't usability problems. They were perception barriers keeping a retention tool from reaching most of our customer base.
My role
I handled most of the design personally. Within two sprints, we moved from research through concepts, testing, a native hackathon, iterations, and engineering handover.
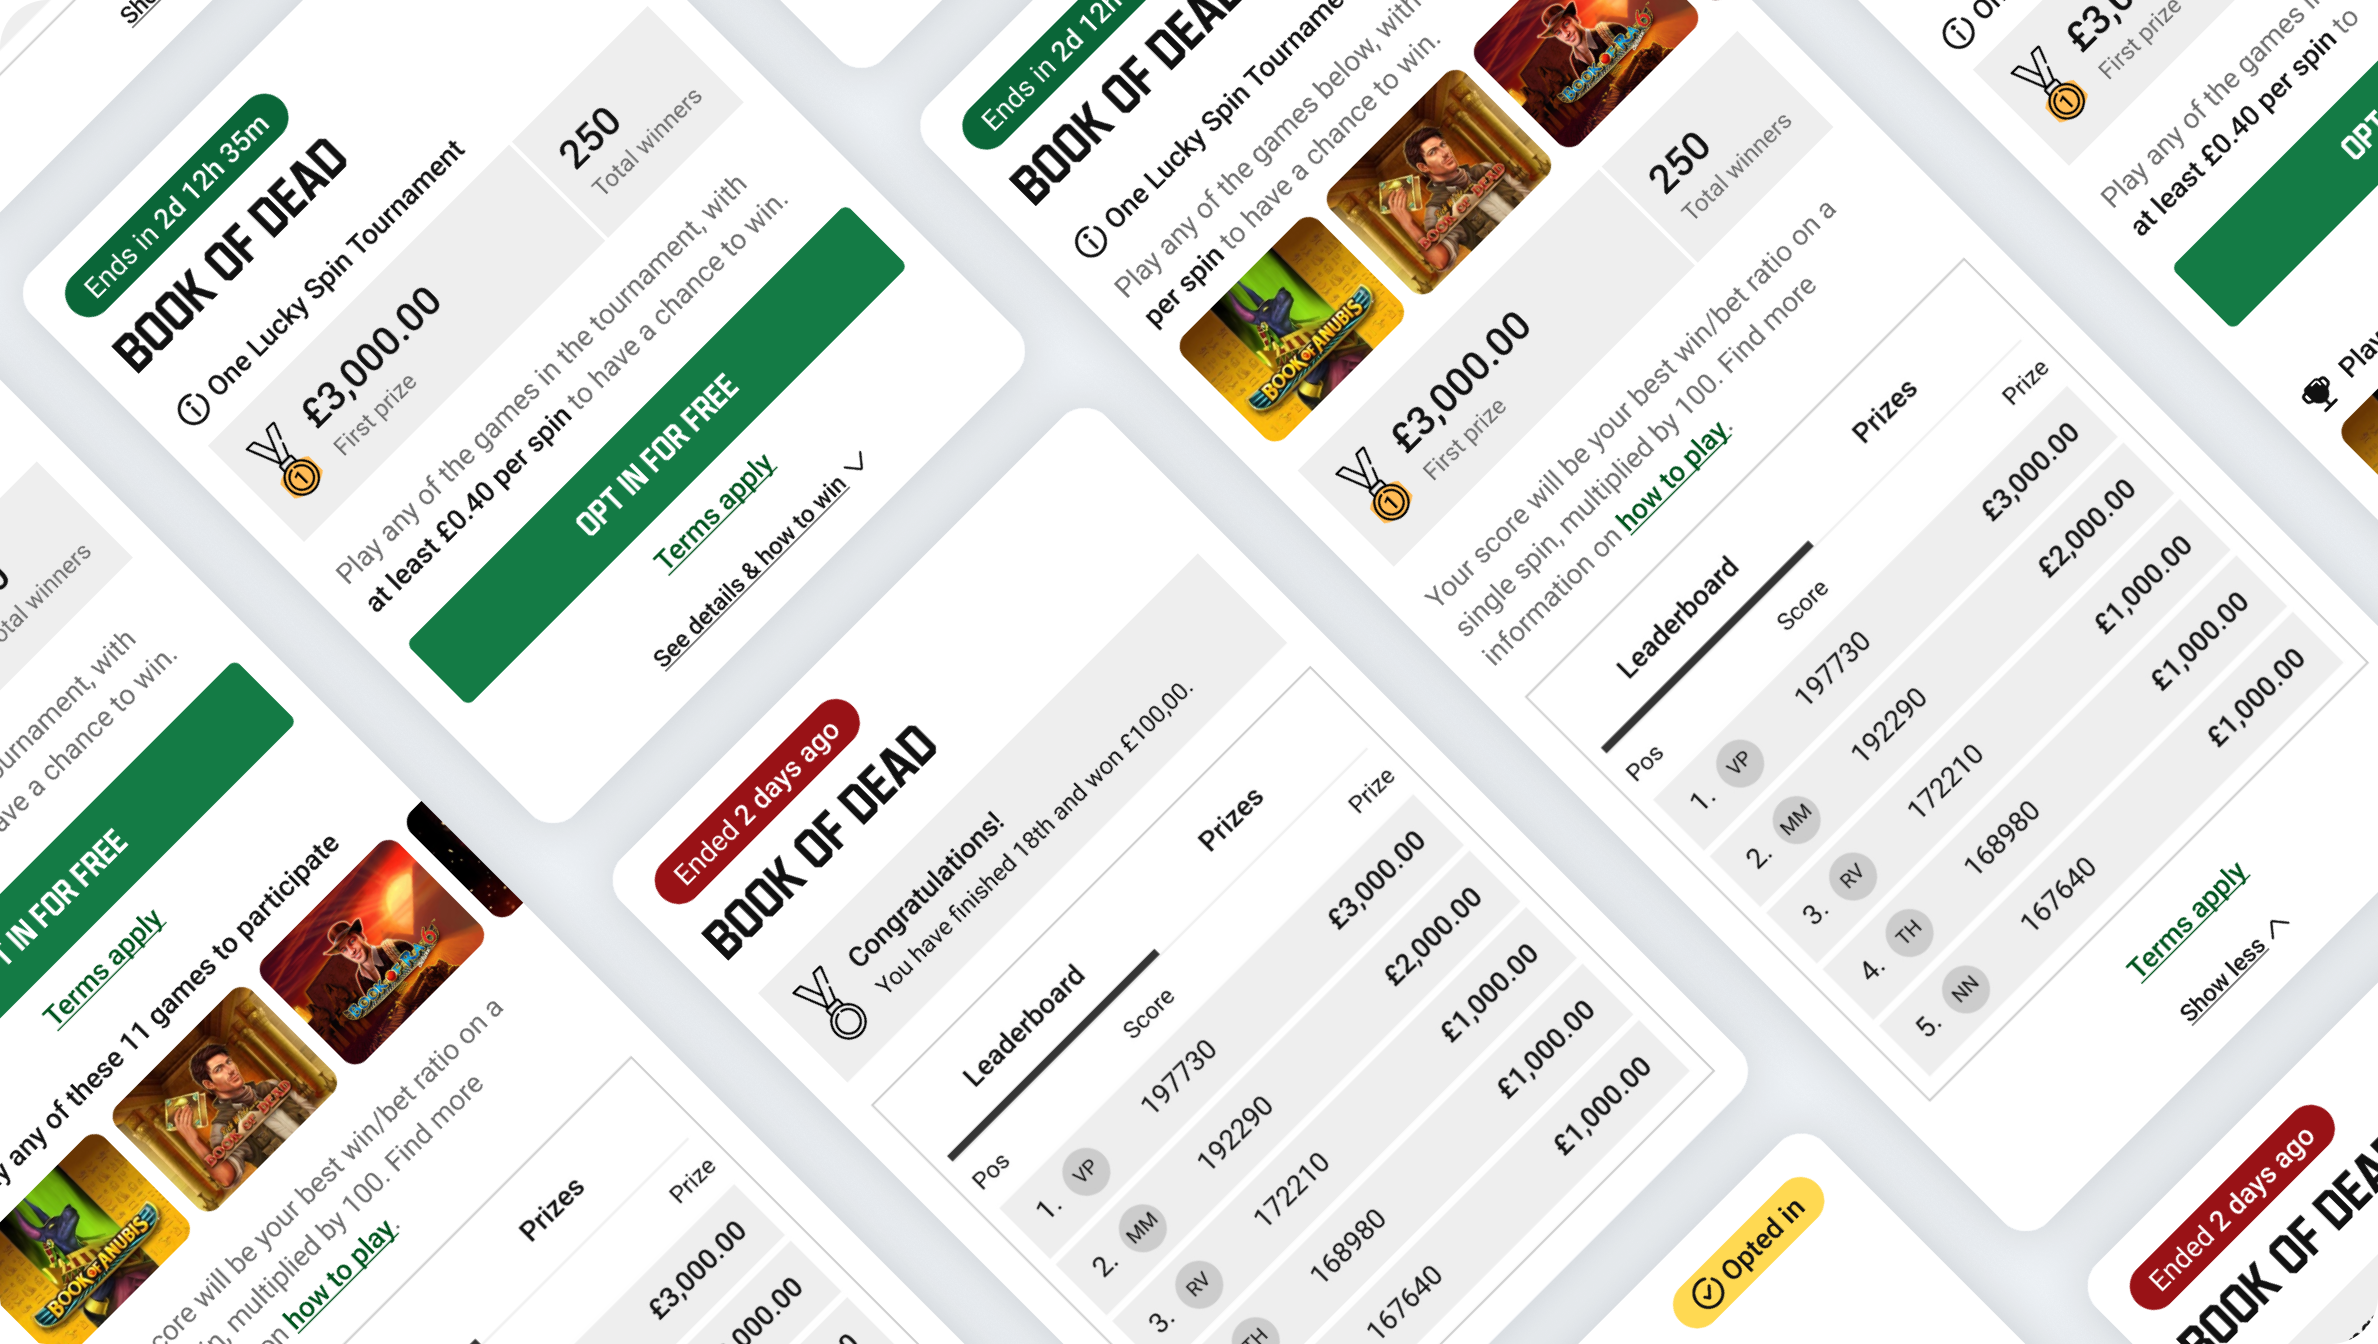
Working closely with the content designer, we rethought how tournaments were described and promoted, making tournament type, timing, and participation cost immediately scannable and honest about what was actually required.
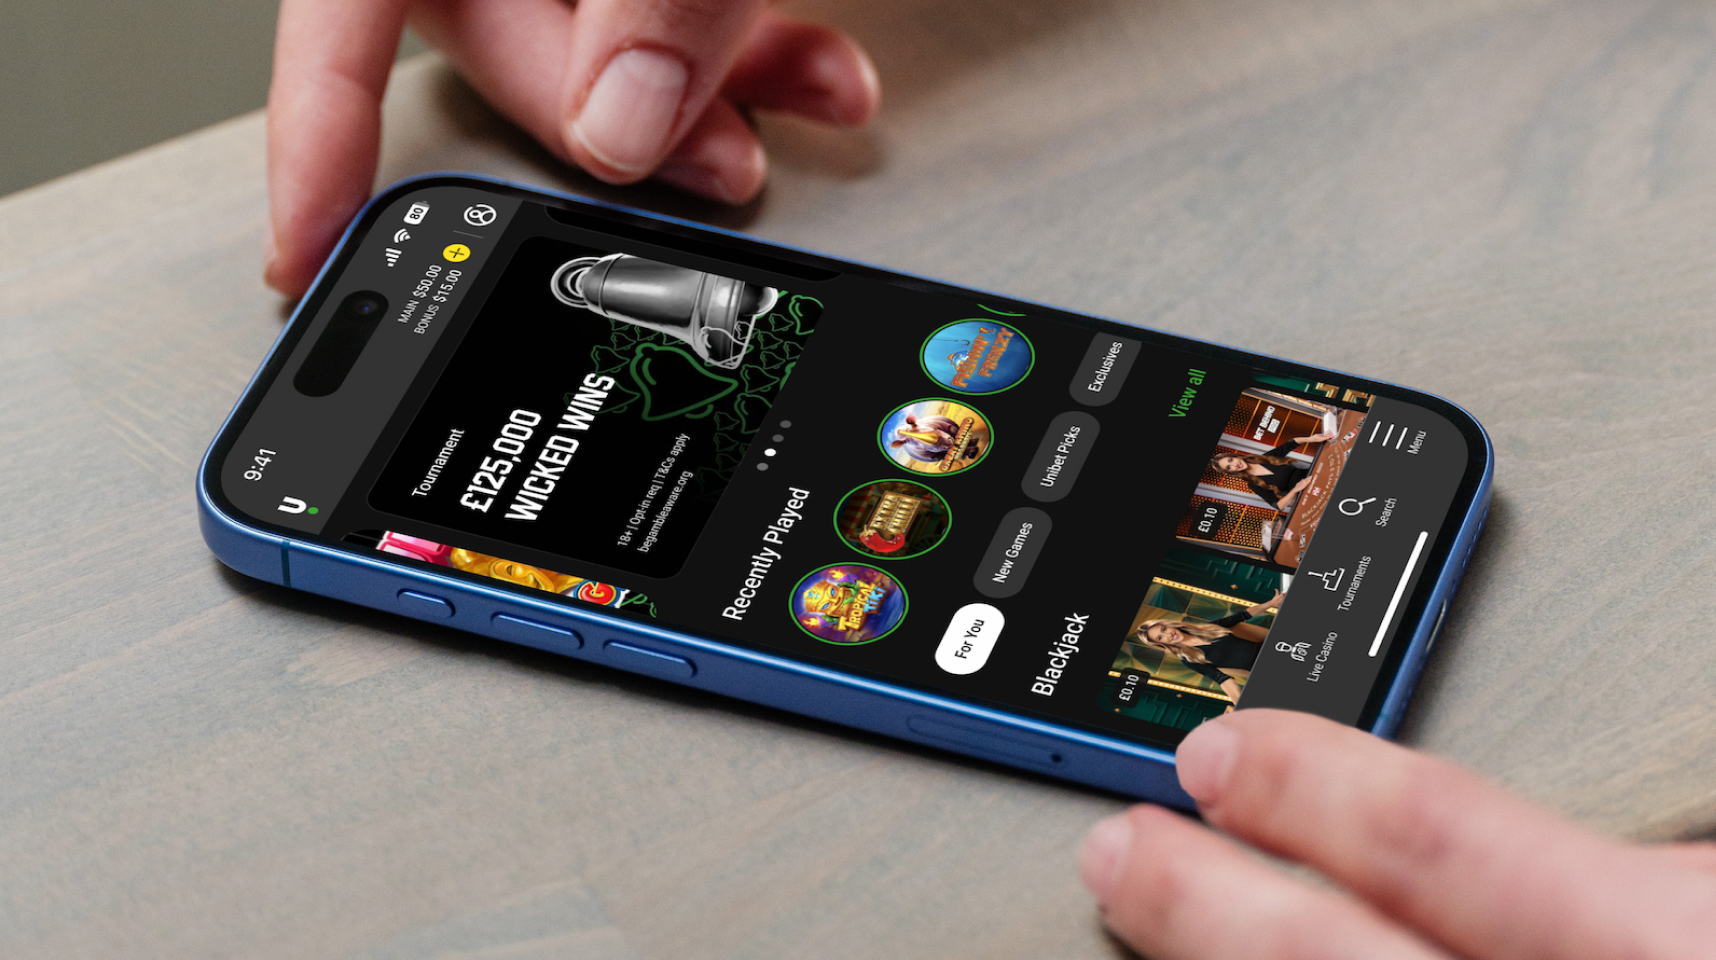
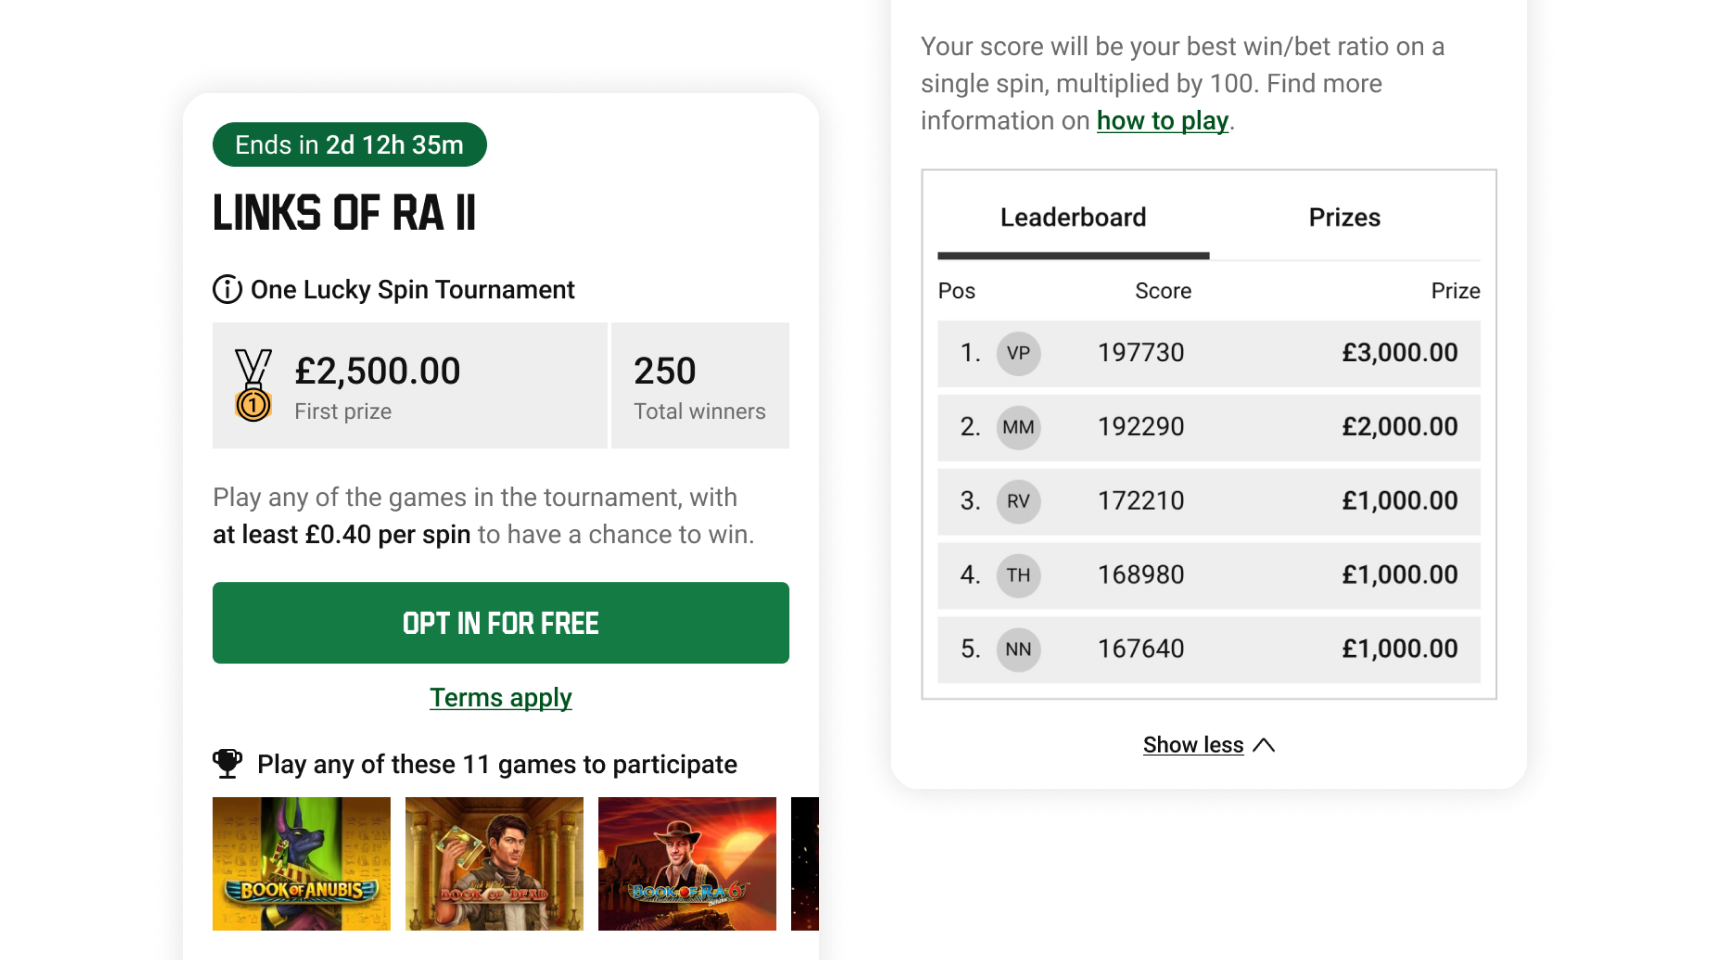
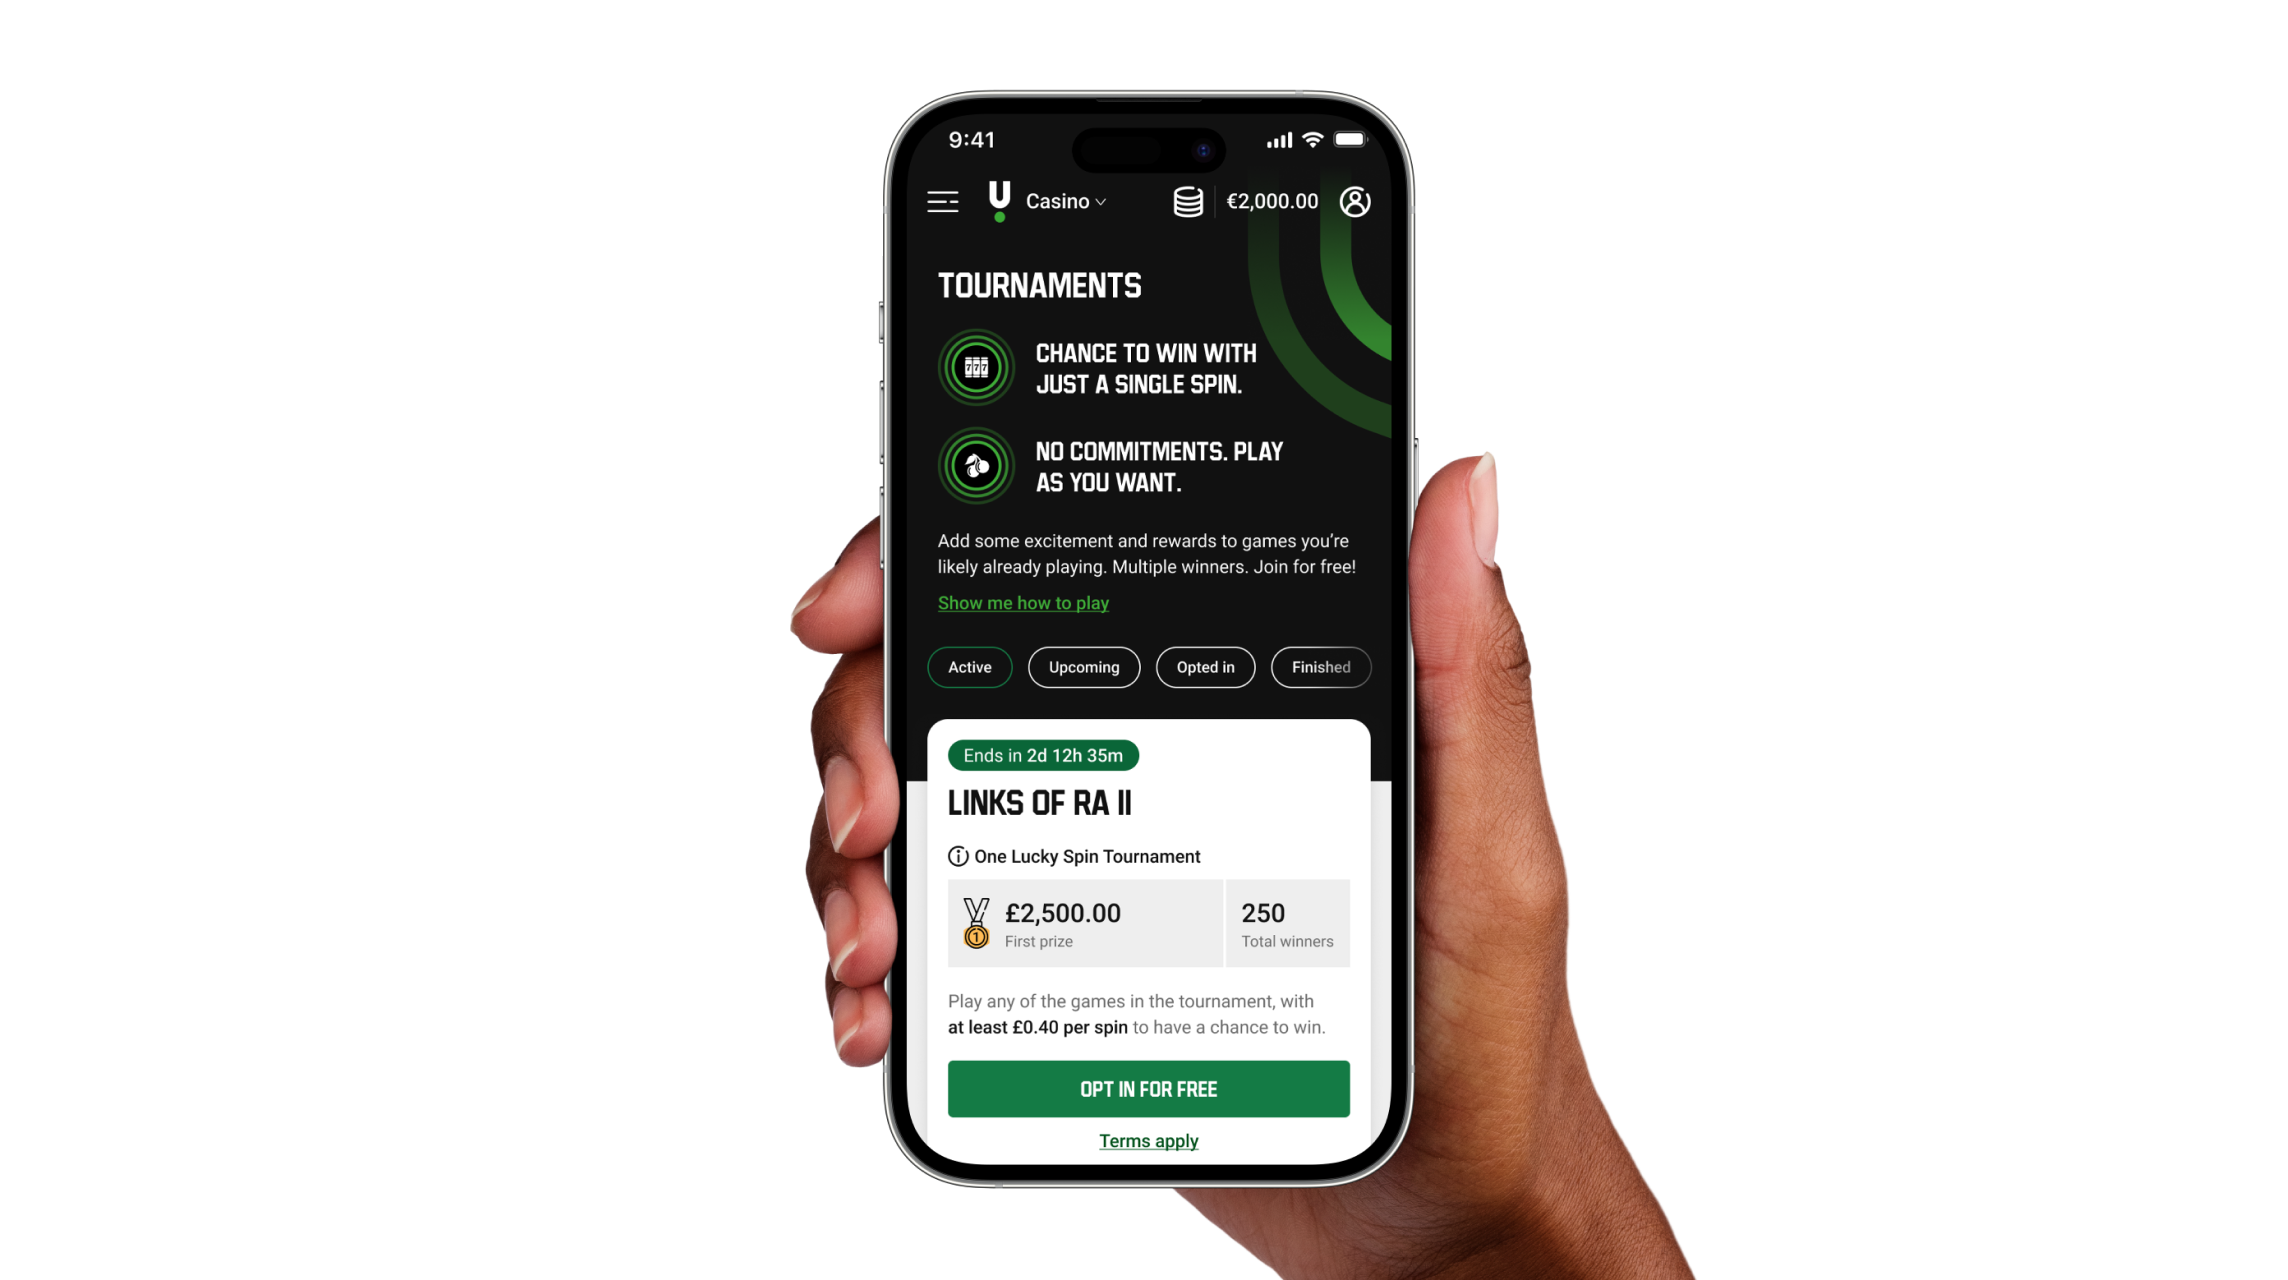
Redesigned hero section.
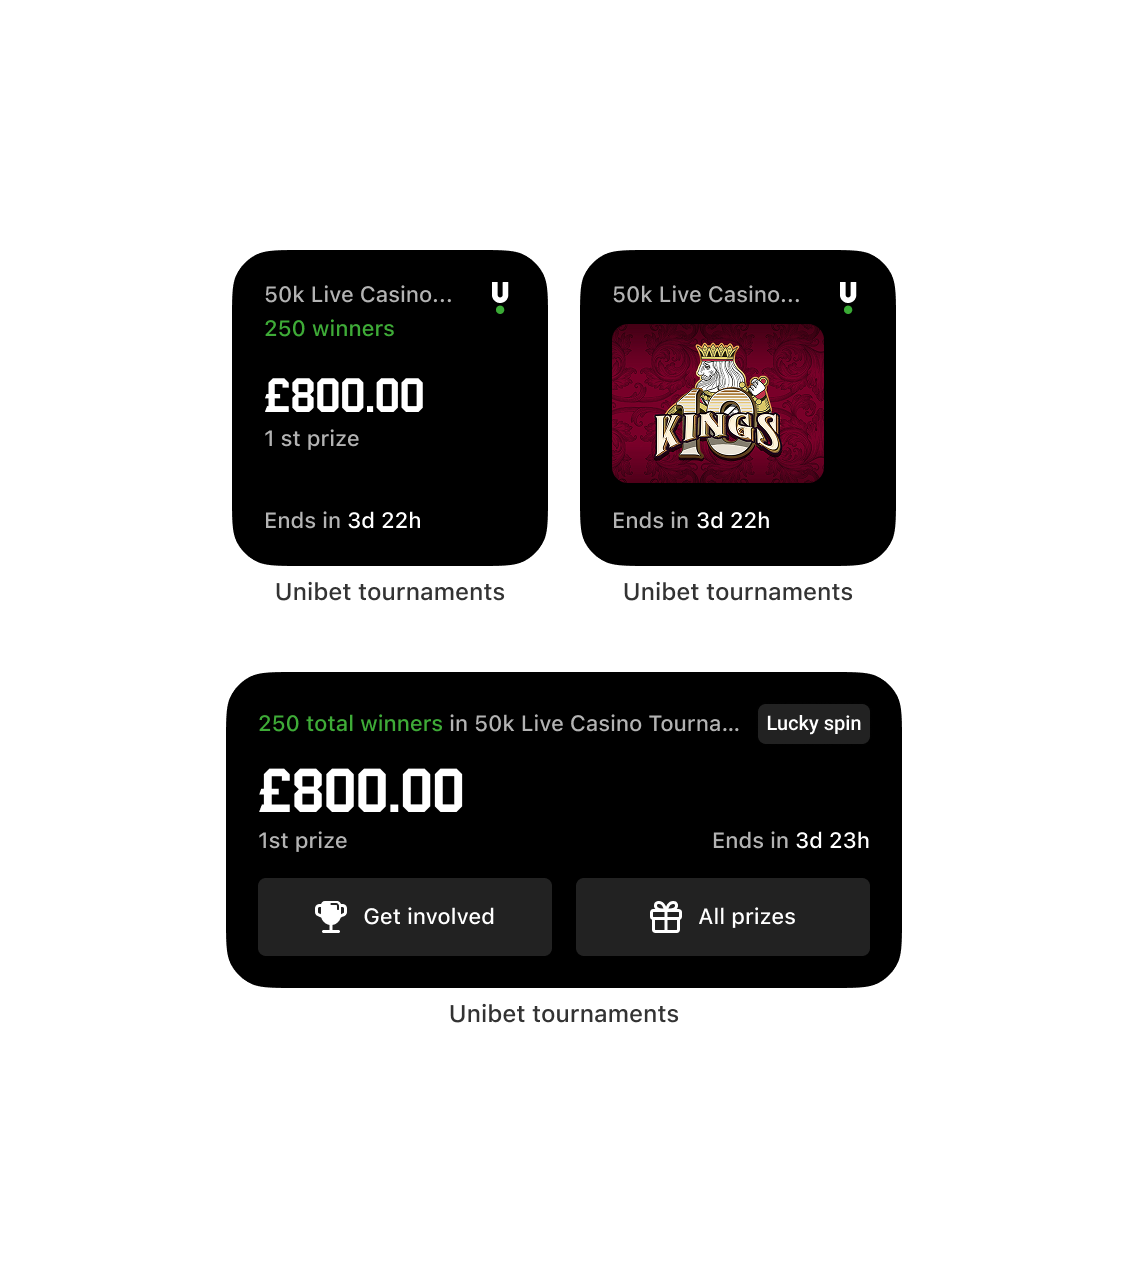
Home screen widget.
Addressing the perception and timing issues
I redesigned the UI to feel more modern and to surface the information that mattered for the decision to opt in and keep playing.
On native, tournaments didn't exist yet, so we built them from scratch. During the hackathon, the first ever in gaming, we built push notifications for tournament starts, and I designed iOS home screen widgets that let customers track their position and timing without opening the app.
We also added real-time progression updates with leaderboard visibility in the first native iteration to motivate continued play.
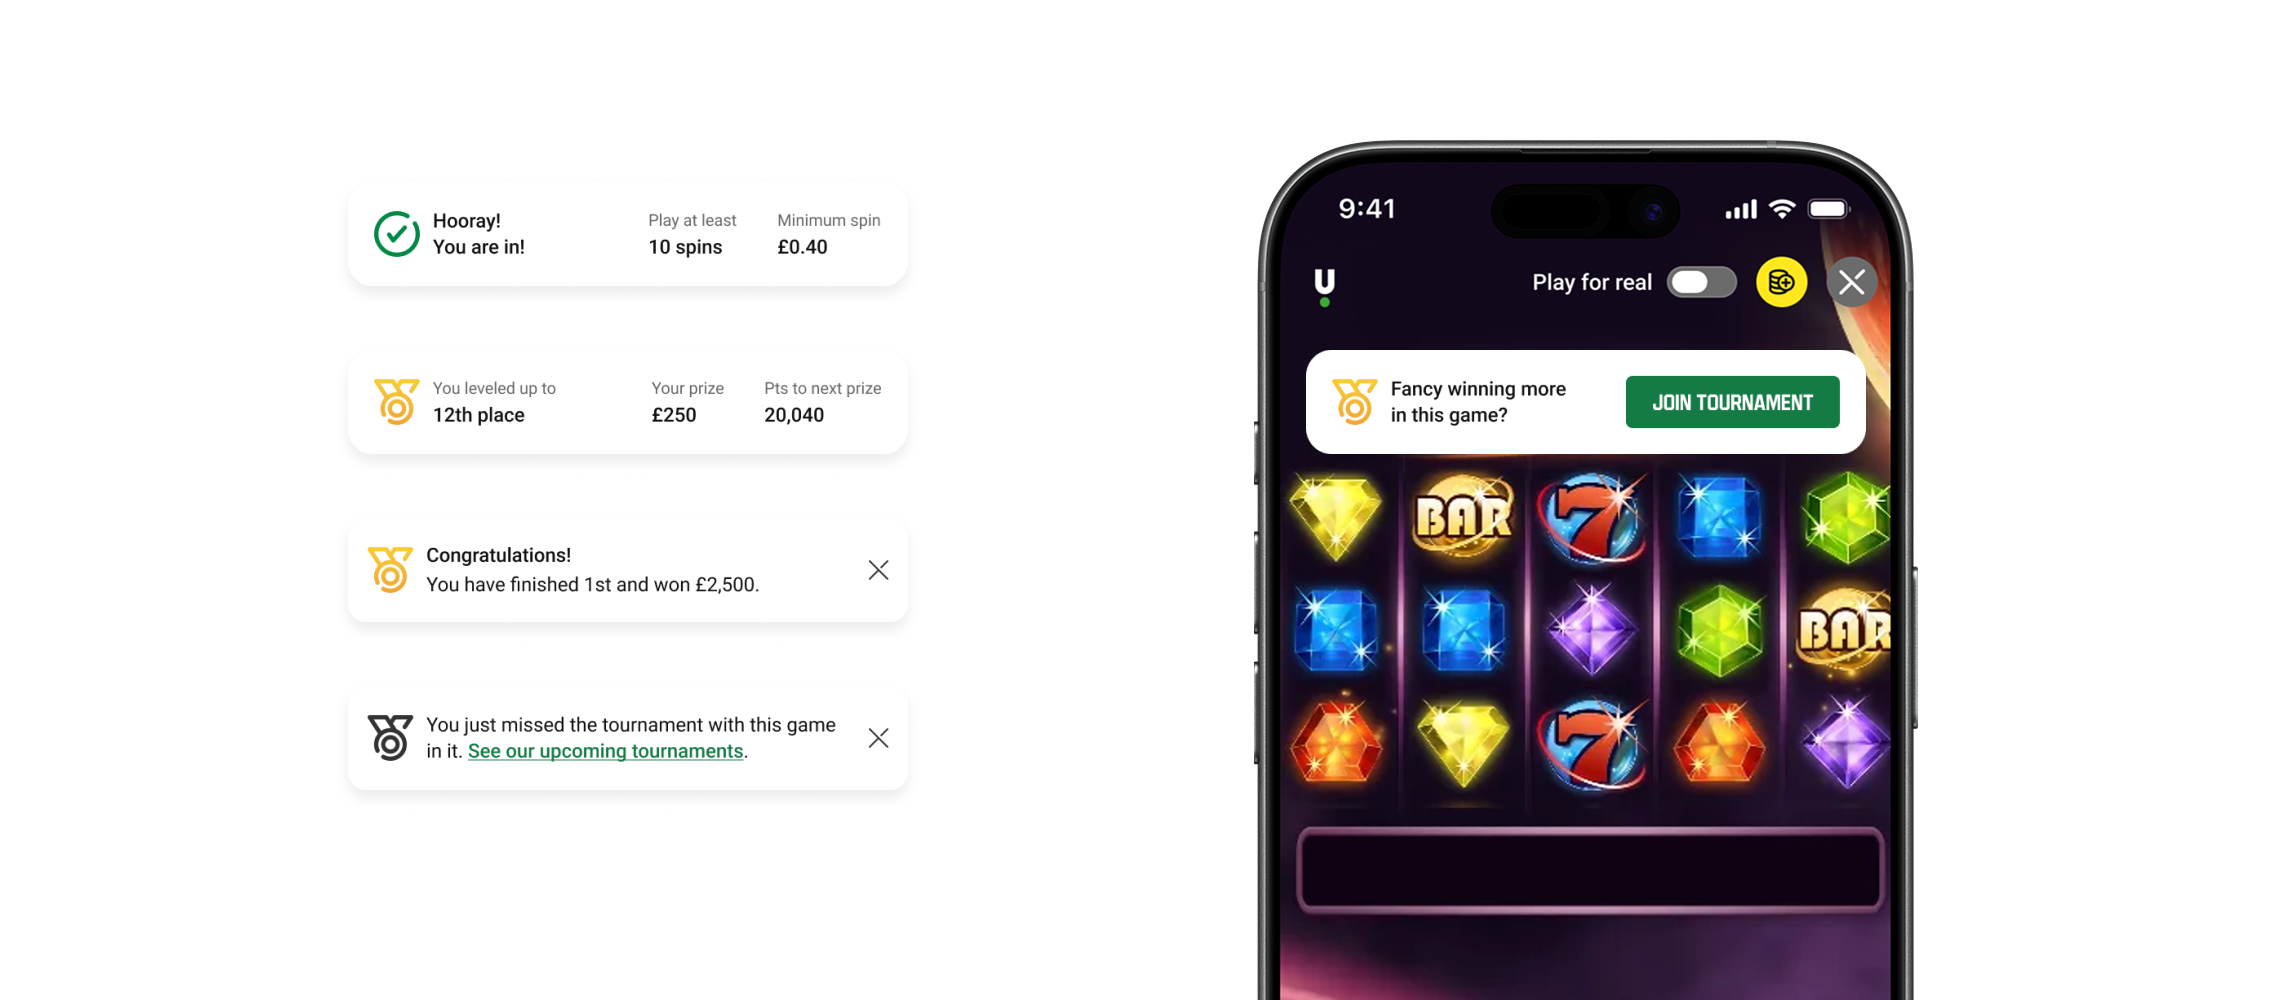
Right information at right time
One design decision I'm particularly glad we made was introducing contextual prompts within the in-game experience.
If a player was already playing a game that qualified for an active tournament but hadn't opted in, we surfaced that information without disrupting their session. The opt-in was frictionless, the potential upside was visible, and there was no cost or commitment required.
It reframed tournaments from something you had to seek out into something that met you where you already were.
The friction
The biggest constraint was tournament imagery. We needed backend support to use existing marketing images, and couldn't secure it.
The web team declined to work around it, but the native team collaborated on an alternative: template images composed from game tiles of included games. It wasn't ideal, but it gave us visual richness from launch.
I also pushed to redefine the success metric.
Stakeholders wanted to measure opt-ins, but only 20% of opt-ins progressed. Growing opt-ins alone would have been a vanity metric.
I argued for progression rate as the primary measure, because that's where engagement and revenue impact lived.
Results
- Tournament progression doubled from 20% to 40%
- Average turnover grew from £6M to £9.5M per tournament
- All four perception issues from discovery were resolved